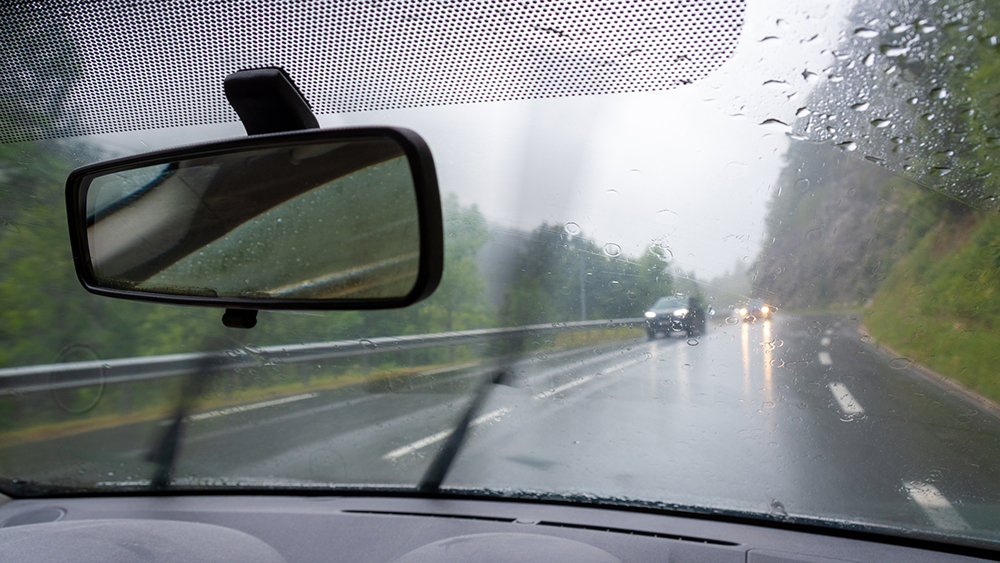
Low-friction road-pavement surfaces are rarely the only cause of vehicular accidents; multiple factors typically contribute to such events. However, it is well-accepted that the most significant factor is when friction demand exceeds what the road surface can provide. As such, friction levels directly contribute to road safety and need to be accurately measured in order to provide a more holistic understanding of safety performance.
Even so, for pavement safety assessments, not much has changed for decades. This is despite significant improvements in automotive braking systems and the exploration of alternative methodologies for pavement-surface assessment. Not surprisingly, then, current methodologies continue to involve test tyres assessing frictional resistance.
Interest has always existed in the relationship between texture and friction, in part because texture can be assessed with non-contact technologies. Unfortunately, data on friction and texture were previously not collected with sufficient density and precision to establish any meaningful relationships.
The type and volume of traffic loading, how the surface wears and how the surface disperses rain water all contribute to the frictional properties of a trafficked surface. All road surfaces have some areas of inherently low or irregular, unpredictable friction because of surfacing material types and/or wear due to traffic and climate over time.
These areas may vary considerably from one location to the next. Therefore, conducting continuous assessment of the full road network at regular intervals is the only reliable method to locate areas of higher risk, determine appropriate intervention levels and take appropriate remedial intervention.
As authorities explore the rapidly advancing technology for improving their safety assessments, questions are being raised regarding how best to implement this data. What is required to pro-actively identify segments in need of corrective treatment applications?
TECHNICAL APPROACH
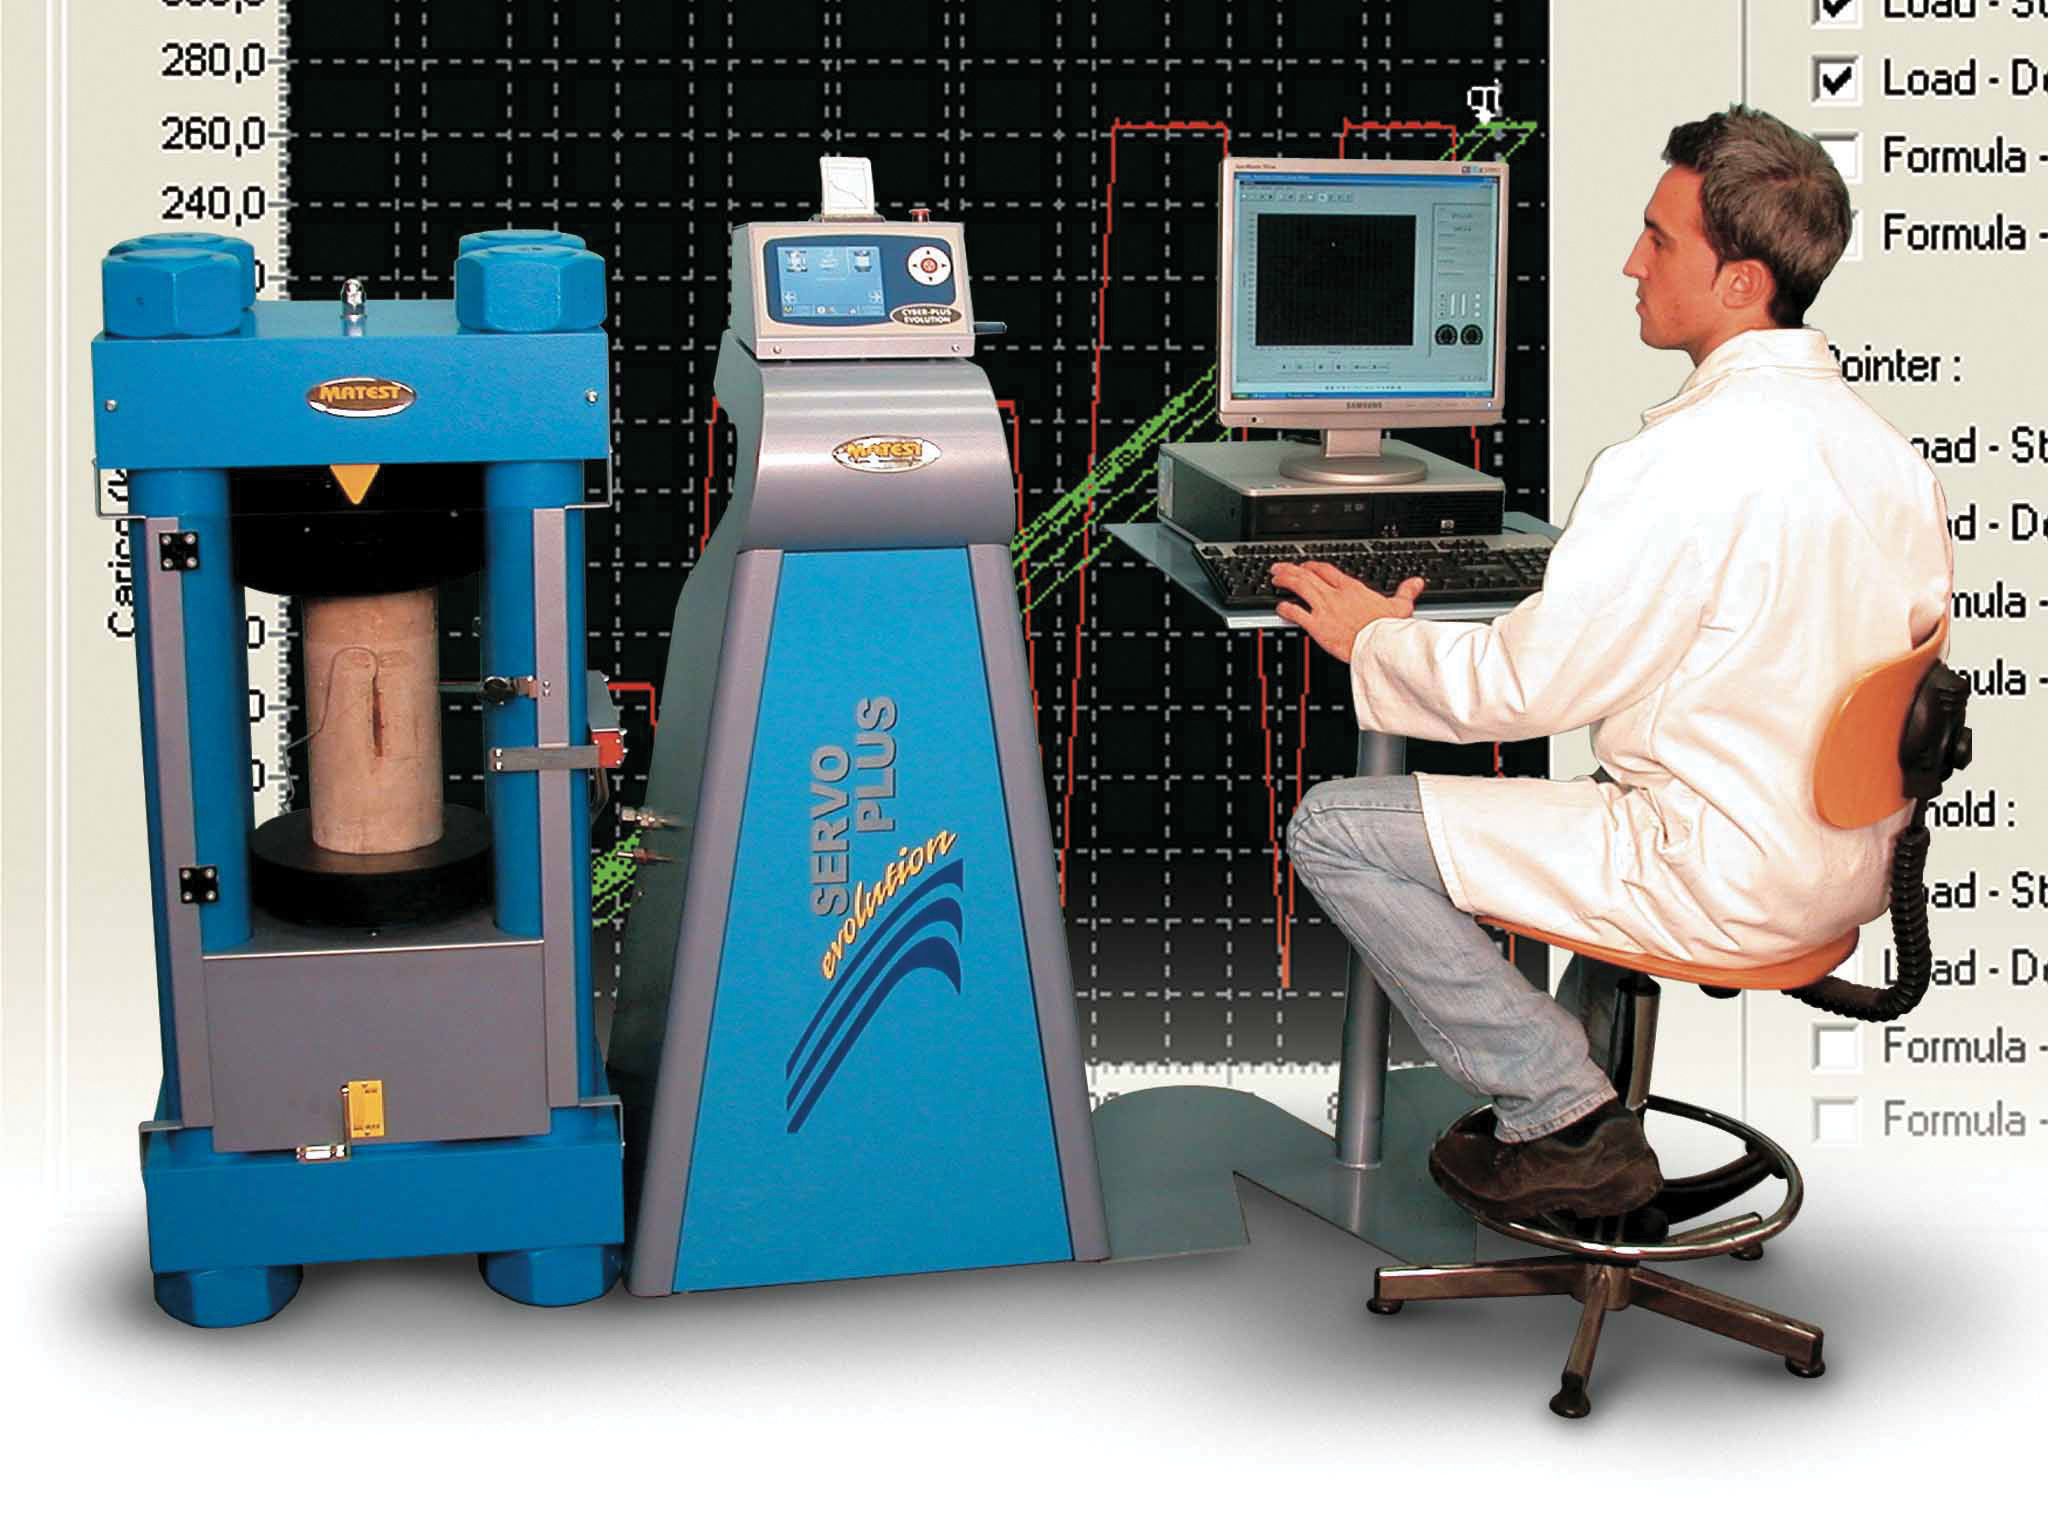
The typical testing methodology of a locked-wheel skid tester (LWST) requires that the test wheel be progressively braked over a period of time up to the fully locked state before releasing again ready for the next test. The full-lock/release requirement means that measurements can be recorded only discretely over short intervals of time. This typically results in less than 2% of the pavement surface being tested and often without repeatability. With the difficulty of aligning spot tests within short curves and intersections, it is common that these critical areas of high-friction demand are not tested.

Sideway-force coefficient (SFC) is the ratio of sideways force over vertical force
In comparison, a sideway-force coefficient (SFC) device measures 100% of the wheel-track surfaces, continuously, with reporting intervals as granular as 0.1m. Continuous sampling is particularly important on those localised sections within a network that have high demand for friction, such as horizontal and vertical curves and intersections. These areas usually have the highest levels of aggregate polishing and surface wear due to the action of traffic manoeuvres and, ironically, are where discrete friction devices do not measure accurately or even at all.
There needs to be a complete picture of road safety with all the data needed for comprehensive friction and safety evaluations. To get this, continuous friction needs to be collected simultaneously with macrotexture from surface-texture (mean profile depth, MPD) data, as well as rutting and geometry data for potential water ponding, rainfall surface-flow determination and digital imagery for visual road-safety risk assessments.
SIDEWAY-FORCE COEFFICIENT
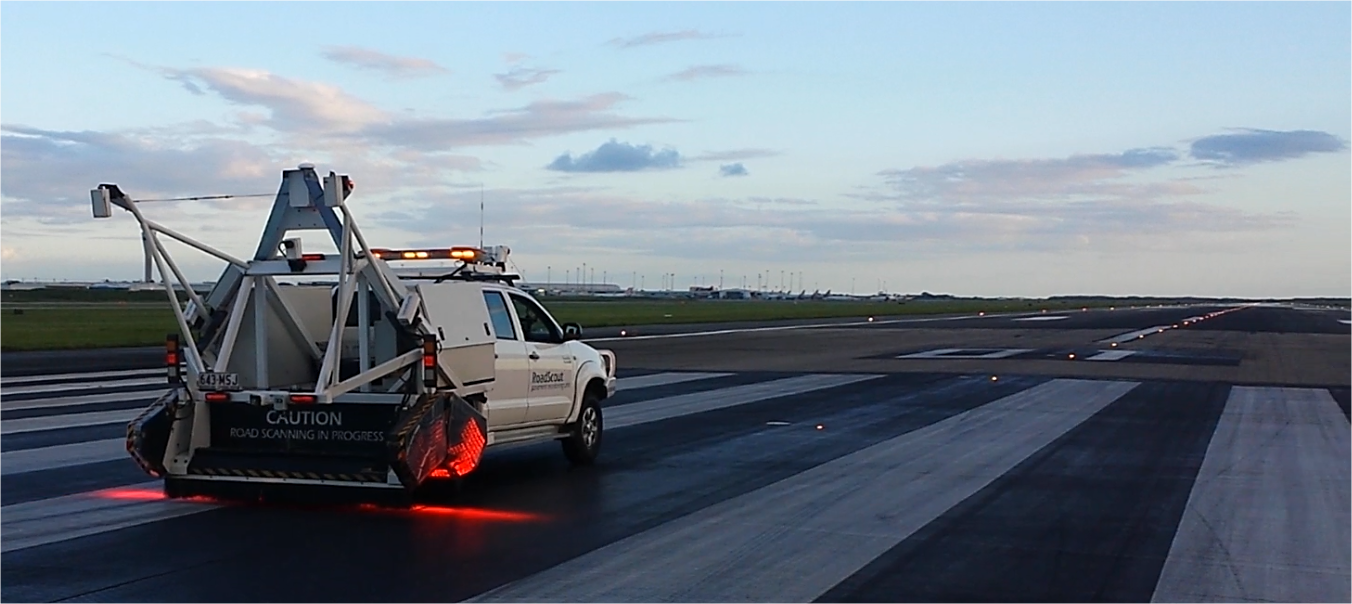
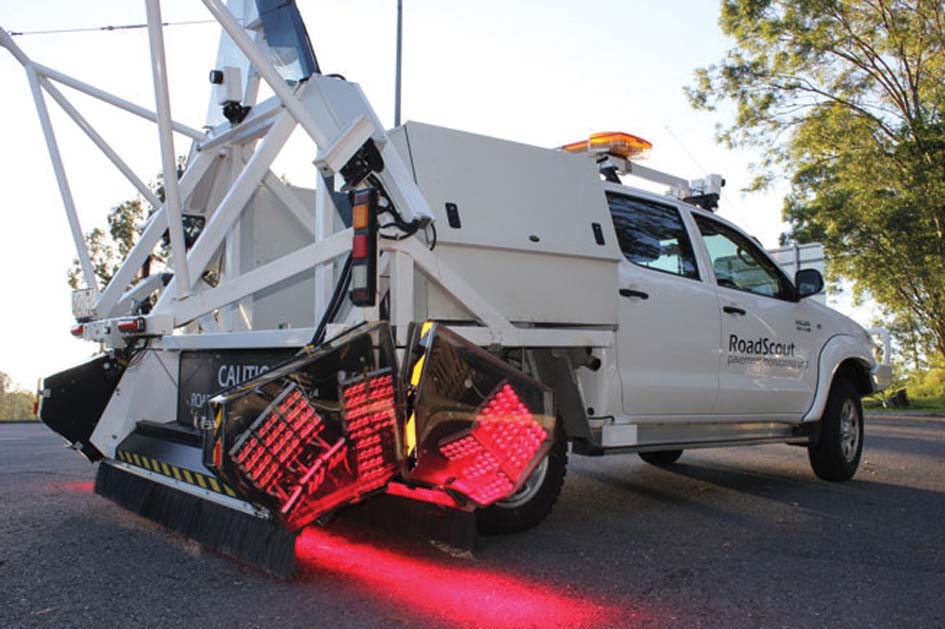
An SFC device measures the traction availability of the road surface. The measurements can be attained in both wheel paths continuously. An SFC device is capable of collecting significantly more data than traditional locked-wheel or other trailer-mounted continuous-friction measuring equipment.
The device uses an instrumented measuring wheel that is angled to the line of the chassis in the wheel path(s). The test tyre is freely rotating (no restriction). However, as it is set at an angle, the tyre is compelled to slip over the pavement surface as the vehicle moves forward. The sideway-slip resistive force can then be measured through the wheel axle via a load cell.
These measurements are continuous while the vehicle is moving; side-slip friction resistive forces are always being generated by the forward motion of the vehicle. The angle of the wheel is chosen to be sufficient to generate this sideways force while remaining unaffected by typical road curvature.
To determine the SFC, the variables measured are the vertical downwards force on the test wheel - nominally 2kN - and the sideways (horizontal) force on the test wheel (see Figure 1).
The two friction parameters derived from the measurements are:
- Sideway-force coefficient (SFC) which is the ratio of the sideways force to the vertical force;
- Sideway-force ratio (SFR) which is the SFC x 100 (effectively a percentage).
LONGITUDINAL PROFILE
Integrating additional traditional surface-assessment systems provides simultaneous collection of other useful data including longitudinal profile.
SURFACE TEXTURE/MACROTEXTURE
Macrotexture of the pavement surface is collected using three non-contact 32kHz lasers. The speed of the laser is sufficient that texture height measurements are made every 1mm or less at speeds of up to 100kph. The three texture lasers are situated in each wheel path at 950mm as well as along the centre of the vehicle for comparison purposes.
RUT MEASUREMENT
Laser rut measurement systems (LRMS) are used to digitise transverse sections of the pavement. The transverse profile of the pavement is documented from 12,80l points over a nominal 4m width. Custom optics and high-power pulsed laser-line projectors allow the system to operate in full daylight or in full night conditions.
With a 150Hz sampling rate, this equates to one transverse profile being recorded every 1mm of longitudinal travel per kph of travel speed (i.e., every 100mm at 100kph). It does this with a nominal transversal resolution of ±2mm with a nominal depth accuracy of ±1mm.
Meanwhile, there are several spatial referencing methods, tools and measurements to be attained.
DISTANCE MEASUREMENT
Calibrated distance-measuring devices provide linear referencing. Conducting appropriate calibrations prior to the start of each survey provides greater confidence in the positioning of the data and findings. Having calibration routines within the acquisition software facilitates the calibration process.
SPATIAL POSITIONING
Global navigation satellite systems (GNSS) and inertial navigation systems collect spatial position under all conditions with sub-1m accuracy, along with high-accuracy road-geometry information.
Geometry data can be processed as grade (longitudinal slope), cross fall with range of ±15% along with horizontal and vertical curvature, sampled every 2m of longitudinal travel. It can be reported at any desired interval above 10m.
IMAGING
Digital imaging cameras are calibrated, enabling the position of all road and associated assets to be measured linearly and/or referenced geospatially. All cameras have a continuous camera-calibration grid enabling real-time and post checking of calibration alignment and azimuth during a survey. Cameras are enclosed in the cab to eliminate fogging and condensation distortion-free light transmission is provided through the high-optic-quality glass.
Captured images are referenced to linear position (in relation to road location information) and geospatially (latitude and longitude). This makes it possible to locate defects or features on the network by chainage and spatial coordinates. This also makes it possible to capture inventory information, complete with a unique GPS position. Even if other existing asset assessments are not required at the time, the recorded information may still be used to note inventory or condition at a later date.
SYNCHRONISATION OF DATA
To ensure precise synchronisation of the collected data, all data streams and reference measurements are recorded from the same original source of odometer distance measurement instrument (DMI) and GPS receiver (spatial coordinates). They are aligned through a high-precision software module to synchronise output data at desired road-location referencing intervals.
Acquisition navigation functionality can deliver faster project completion times, accurate location referencing and reduced error through GIS-based (geographic information systems) referencing and real-time survey route planning.
From experiences to date, several common and recurring scenarios are observed when gathering a more thorough set of continuous safety parameters. The following representative cases depict how these scenarios actually impact strategic maintenance planning.
For the purposes of this discussion, pavement sections are categorised into cases with conditions as follows:
- low friction and/or low texture, but all other metrics are within acceptable tolerances;
- low friction and/or low texture, with additional conditions that impact surface water (i.e., transverse profile concerns, geometric transitions, abnormal precipitation);
- acceptable friction and/or texture but similar conditions that impact surface water.
Each of these cases will be discussed below with examples provided for consideration. For some, the perception is that friction alone can be an indication of a safety hazard. While this may occasionally be true, it is not always the case. More comprehensive safety assessments are needed to evaluate the presence of other contributory factors to aid in the planning of appropriate interventions.
CASE ONE
When conducting comprehensive safety assessments, it is possible to identify locations where the friction and/or texture is the only cause for concern.
Consider:
a) Without comprehensive safety assessments, it is possible these cases may go undetected.
b) Without geometric concerns or the presence of surface water (from transverse profile issues or drainage concerns), such cases may not, in fact, present the most significant safety hazards.
c) Using only discrete friction testing may trigger planned but unnecessary surface-treatment maintenance.
CASE TWO
In instances where low friction and/or texture are present along with conditions that impact surface water ponding (see Figure 2).
Consider:
a) Geometric concerns or the presence of water (from transverse profile issues or inadequate surface drainage), typically necessitate more extensive remediation measures.
b) With only friction testing, these other critical distress mechanisms may go undetected.
c) Merely improving the friction characteristics with a suitable surface treatment may not necessarily address the underlying cause of these cases.
d) Comprehensive full-spectrum safety assessments are the only way to identify whether appropriate remedial intervention is required.

CASE THREE
As is generally recognised, there are instances when acceptable friction and texture may be present but other conditions may exist that impact safety (see Figure 3).
Consider:
a) Transverse profile (rutting) and/or other geometric issues that create the presence of standing surface water and generally poor surface-drainage capability will create significant safety hazards, regardless of other conditions.
b) Similarly, adverse geometrics (in horizontal or vertical curvature) will also be significant cause for concern.
c) With friction testing only, other concerns may well go undetected.
d) Comprehensive safety assessments help to identify and confirm these occurrences and provide for appropriate remediation options.
e) Surface treatments alone may well not be the optimal solution in such instances.
Perhaps of greatest importance is the recognition that, regardless which case applies, continuous data provides for a significantly more detailed assessment within a project or network assessment. Rather than assigning an “average” or “typical” condition for treatment selection and design, discrete sections can be identified with measurable confidence and accuracy. This offers the potential for isolating and treating areas of actual need. This enables project-level decisions to be made with network-level data. The result is a better understanding of the context of these project sections.
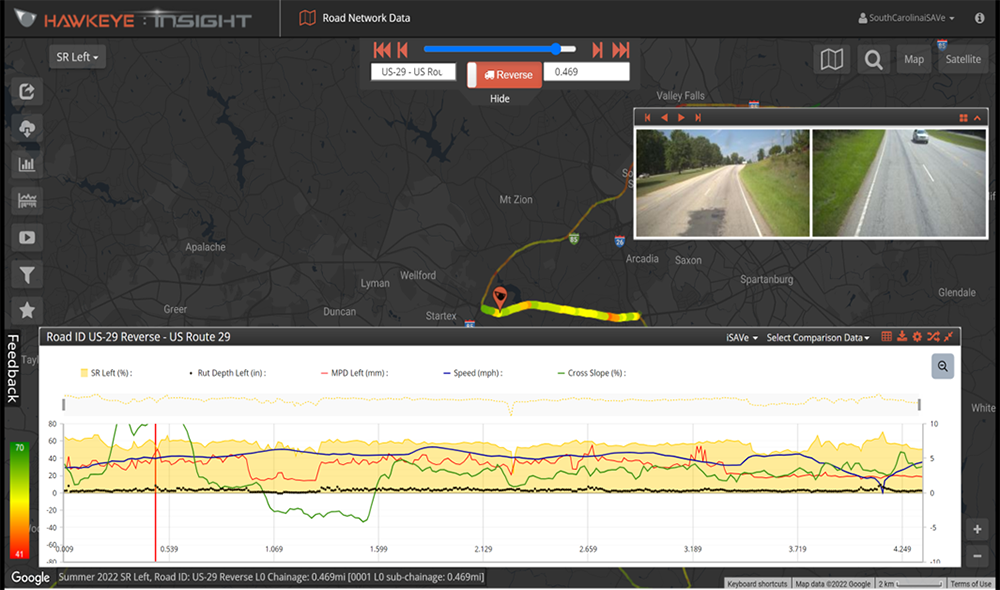
From the examples above, it can be seen that even with these more comprehensive assessments, relationships between friction and macrotexture from line lasers show no consistent relationship. Additional assessments are warranted to better understand the relationships between these and other related safety parameters to help improve our ability to provide safer roads.
CONCLUSION
The challenges of assessing pavement conditions have historically led to a perceptible gap between network assessments and project-level design of specific treatment applications. The increasingly apparent limitations of traditional methods of safety assessment (insufficient sampling, inability to collect multiple influential factors simultaneously, challenges of proactively identifying areas of need and relatively high testing costs) are necessitating exploration of new solutions.
Assessment of friction, texture and other functional parameters collected continuously and simultaneously with other pavement performance metrics are providing a more comprehensive assessment of safety needs; project-level applications are becoming more prevalent.
The overall impact is still to be determined but, as seen from the limited examples cited above, researchers are eager to explore the possibilities of integrated full-spectrum road-condition data collection.
Closing this gap between network assessment and specific treatment-design applications is generating:
- more comprehensive pavement safety assessments, with greater value and applicability of the data collected;
- the ability to more proactively identify safety concerns;
- the ability to better optimise network safety;
- improvements to the efficiency and effectiveness of project-specific treatment applications;
- discussions on how more economical it is in terms of time and finances to use continuous network-level friction data for input into the project-level remedial design process.
Initial studies have shown that it is more costly to undertake discrete testing rather than continuous friction measurements when it is
Moving forward, most highways agencies and road-network owners accept the merits of network assessments. They are focused on how best to accommodate such data in existing management systems. Project-treatment applications are still being formulated. Data is currently being used to identify specific portions of projects that merit being treated differently from the majority of the project. This can include spot repairs of surface treatments, profile or geometric changes or other measures to mitigate safety concerns.
As observed in the cases above, the ability to conduct more comprehensive continuous safety assessments will identify optimal remedial interventions in a pro-active systematic manner. This has a direct impact upon the maintenance budget of road agencies and road network owners.
As discussed earlier, even with these more comprehensive assessments, relationships between friction and macrotexture from line lasers show no consistent patterns. Additional assessments are warranted to better understand the relationships between these and other related safety parameters to help improve our ability to provide safer roads.
*Simon Tetley is with ARRB Systems South Africa in Cape Town: simon.tetley@arrbsystems.com
Associate authors:
- Jerome Daleiden is with ARRB Systems Americas in Exton, Pennsylvania: jerome.daleiden@arrbsystems.com
- Claire Taylor is with ARRB Systems South Africa, in KwaZulu-Natal: claire.taylor@arrbsystems.com


