The second comprehensive transport study of Jiangsu Province is a good example of road policy in action. Samuel C F Wong, Technical Director, Scott Wilson Ltd explains Jiangsu Province on the eastern coast of China, with a population of 76 million, is one of the fastest growing in the country. Between 1990 and 2007 GDP growth averaged some 16%/year. Economic growth, however, has not occurred evenly. Two-thirds of the province's wealth has accumulated in its southern half. With Jiangsu's rapid economic expan
The second comprehensive transport study of Jiangsu Province is a good example of road policy in action. Samuel C F Wong, Technical Director, Scott Wilson Ltd explains
Jiangsu Province on the eastern coast of China, with a population of 76 million, is one of the fastest growing in the country. Between 1990 and 2007 GDP growth averaged some 16%/year. Economic growth, however, has not occurred evenly. Two-thirds of the province's wealth has accumulated in its southern half.With Jiangsu's rapid economic expansion there is an urgent need to upgrade transport infrastructure. To satisfy both national and provincial strategic objectives a number of corridors have been identified as priorities for future development.
Scott Wilson has assisted with the planning of four of these key corridors, the most recent, in 2003-5, being the second Jiangsu Expressway Network Planning Study.
In the first Jiangsu Expressway Network Planning Study, Scott Wilson developed a plan to construct a 3,500km network of expressways by 2020, comprising a network of four vertical and four horizontal routes, four connective links and five river crossings. The plan aimed to connect all 11 cities and 80% of counties within Jiangsu Province. This plan formed the basis of Scott Wilson's subsequent studies.
Between 1996 and 2007 the annual rate of expressway construction averaged some 30%. By 2007, there were more than 2,000km of expressways open to traffic, whereas in 1996 there were only 318km of expressways in Jiangsu Province.
The current study background: the provincial government recently commissioned Scott Wilson to undertake the new plans for the expressway network and river crossings of Jiangsu Province for the period 2001-2020. These plans aim to enhance the transport capacity of Jiangsu's expressway network, support the economic integration of big cities in the Yangtze River Delta, promote the construction of bridges over the Yangtze River, and push economic development downriver. The scope involved conducting, for the whole province Origin-Destination (O-D) surveys and traffic counts; development of a Traffic Forecasting Model; developing a future expressway network and river crossings' layout plan; developing a future expressway standard layout plan and developing a future expressway construction priority plan.
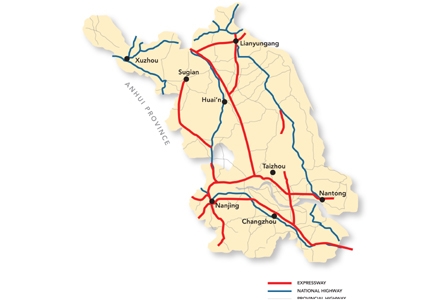
A computer-based transport model was developed to represent the current road network and traffic flows. The existing 2002 highway network (see map) was characterised in the base year highway network model as a series of links (lengths of road) between nodes (junctions). Each link was coded with the following information: highway classification (for example, Expressway, Class 1 Highway, Vehicle Ferry etc); length of highway; width/number of lanes; design speeds; theoretical traffic capacity (in passenger car units/pcu per hour); relationship between speed and flow, and toll charges.
In effect, each link is assigned with a 'resistance' which is a function of a number of factors such as quality of road and toll charges. Tolls levied at all toll stations (for both 'closed' and 'open' systems) within the study area were coded in the base year highway network model. The highway network was modified to include the effect of delays in urban areas caused by traffic turning across the traffic flow and the reduction of capacities at certain points to reflect time delays at junctions, road side parking and increased local and non-motorised traffic where a National Highway or other significant road passes through a town centre.
A number of O-D surveys were carried out at 165 sites. They were of four types: 24 hours and 100% sample (for border and river crossings); 24 hours and 50% sample (for expressways); 12 hours and 100% sample (for other survey stations on screenlines); and 12 hours and 50% sample (for other supplementary survey stations).
Three different types of passenger vehicles and five different types of goods vehicles were identified. In total 165 O-D survey points identified by a set of screenlines were manned over a two-day period by 10,000 traffic survey officers. Total daily traffic flows at each survey point were also counted. From the O-D survey, matrices for each of the eight vehicle categories were derived with 95 traffic zones, of which 77 were within Jiangsu Province and 18 were external to Jiangsu Province.
The eight O-D matrices were aggregated into three matrices for cars, coaches and goods vehicles in pcu to form Base Year O-D trip matrices. The three matrices were then allocated to the 2002 Base Year highway network by multi-class equilibrium assignment.
It should be noted that tolls levied at all toll stations (for both closed and open systems) within the study area were coded in the Base Year highway network model. This includes toll stations for all 15 existing expressways and 109 toll stations on all other existing highways in Jiangsu Province.
The resulting traffic flows were then compared with the data obtained from the actual traffic counts. By iterative refinement to the resistances and the characteristics of the links, the model was improved to get the best possible "fit" between the O-D surveys and traffic counts. In addition, traffic flow data by toll category from the client were also obtained and used as a further check on the model. The model, having been calibrated and validated to reflect the current situation, was further developed to include all proposed roads due for construction, up to the year 2020. For this task, a conventional four-stage transport model was developed.
Traffic forecasting was developed through analysis of historic traffic data from 120 permanent traffic count stations on national highways and 270 traffic count stations on provincial highways throughout the province.
The analysis demonstrates a distinct relationship between GDP and traffic flows; with economic growth leading to an increase in vehicle trips. An income elasticity model was used to examine historic traffic growth and economic growth between 1990 and 2002 for Jiangsu Province, with separate indices being derived separately for passenger and goods vehicles and by four regions (Central Jiangsu, South Jiangsu, North Jiangsu and Jiangsu Province as a whole).
Scott Wilson's transport planners then compared these elasticity indices with data from other countries with similar levels of economic development and road capacity. After reviewing the province's economic forecasts and planned investments in transport infrastructure, we forecasted future year elasticity indices. It was considered unlikely that traffic would increase in tandem with GDP over the longer term and hence traffic elasticities could be expected to gradually decline in the future.
This was concluded because there will be a limit on the number of vehicles people own and the number of journeys made, after which consumption will switch to other sectors of the economy.
However, with regard to goods vehicles, we found that network capacity constraints suppressed freight transport movements. Following the opening of new expressways, extra network capacity was created and this helped to relieve congestion in the study area, leading to increases in road freight. Increased demand in road haulage was also expected because constraints in the rail network capacity suppressed growth in rail freight. Therefore the income elasticity of goods vehicle traffic was predicted to be higher in the short term than previously.
Trip generation, trip distribution, modal split and trip assignment models were all developed. As an example of the rigour applied to the whole work, the modal split model can be described as follows: A Multi-nomial Logit model is used. The proportion of passenger traffic between two zones which will use mode k (Pk ) is a function of the generalised cost of each mode.
ak = Generalised cost of mode k (k = 1 & 2 for railway and highway) A function of direct transport cost, transport time cost, and delay time cost due to service reliability and transport frequency = Calibrated coefficient The proportion of goods vehicle traffic between 2 zones which will use mode k (Pk ) is a function of generalised cost of each mode.
ak = Generalised cost of mode k (k = 1, 2 & 3 for railway, highway and waterway)
A function of direct transport cost, transport time cost, feeder transport cost and value of goods carried
= Calibrated coefficient.
Traffic flows (in pcu/day) and traffic growth, arising from all the work, are shown opposite.
The investment implications are large: for the study period to 2020, we proposed a network expansion of 5,800km of expressways. The proposed expressway network comprises five vertical and nine horizontal routes, seven connective links and eleven river crossings.
Our conclusion is that to sustain China's economic expansion, the country requires an efficient highway network. Despite the challenges and risks involved, there are still many opportunities for financially viable and environmentally sustainable road development in China. To evaluate the viability of a network development/expansion plan, key factors affecting the project return must be examined carefully at the early stages of any project. The proper use of the traffic forecasting model (the four-stage modeling procedure) as an evaluation tool is crucial to successfully planning an expressway network project. Robust traffic forecasts and comprehensive transport plans are the key.
| Yangtze River Crossings | |||
|---|---|---|---|
| 2003 | 2030 | Growth Factor | |
| Nanjing Region | 116,000 | 460,000 | 4 |
| Zhenjiang/Yangshou/Taizhou Region | 18,000 | 290,000 | 16 |
| Changzhou/Wuxi Region | 60,000 | 141,000 | 2 |
| Suzhou/Nantong Region | 29,000 | 213,000 | 7 |
| Total Traffic Across Yangtze River | 223,000 | 1,104,000 | 5 |
| Main Transport Corridors of Jiangsu Province | |||
| 2003 | 2030 | Growth Factor | |
| Liayungagn-Xuzhou | 20,000 | 58,000 | 3 |
| Coastal (North of River) | 23,000 | 119,000 | 5 |
| Coastal (South of River) | 41,000 | 180,000 | 4 |
| Beijing-Shanghai | 31,000 | 111,000 | 4 |
| Along Yangtze River | 79,000 | 119,000 | 2 |
| Nanjing-Xuzhou | 18,000 | 96,000 | 6 |
| Shanghai-Nanjing | 67,000 | 239,000 | 4 |
| Najing-Hangzhou | 27,000 | 83,000 | 3 |
| Shanghai-Yixing | 31,000 | 83,000 | 3 |
 Jean Lalo, Chairman of the IRF Working Group Safer Roads; Sibylle Rupprecht, Director General IRF-GPC; Andrew Graham of the NSW Centre for Road Safety")


