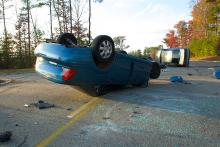
A comprehensive analysis of crash statistics in the US reveals the shocking cost of vehicle crashes. The report has been collated by the by the US Department of Transportation, National Highway Traffic Safety Administration (NHTSA) and is based on details collated for 2010. The report states that in 2010 there were 32,999 fatalities, 3.9 million injured, and 24 million vehicles damaged following crashes in the US. The economic costs of these crashes totalled US$242 billion. Included in these losses are lost
A comprehensive analysis of crash statistics in the US reveals the shocking cost of vehicle crashes. The report has been collated by the by the 2364 US Department of Transportation, 2467 National Highway Traffic Safety Administration (NHTSA) and is based on details collated for 2010. The report states that in 2010 there were 32,999 fatalities, 3.9 million injured, and 24 million vehicles damaged following crashes in the US. The economic costs of these crashes totalled US$242 billion. Included in these losses are lost productivity, medical costs, legal and court costs, emergency service costs (EMS), insurance administration costs, congestion costs, property damage, and workplace losses. The $242 billion cost of motor vehicle crashes represents the equivalent of nearly $784 for each of the 308.7 million people living in the United States, and 1.6% of the $14.96 trillion real US Gross Domestic Product (GDP) for 2010. These figures include both police‐reported and unreported crashes. When quality of life valuations are con
sidered, the total value of societal harm from motor vehicle crashes in 2010 was $836 billion.
Lost market and household productivity accounted for $77 billion of the total $242 billion economic costs, while property damage accounted for $76 billion. Medical expenses totalled $23 billion. Congestion caused by crashes, including travel delay, excess fuel consumption, greenhouse gases and criteria pollutants accounted for $28 billion. Each fatality resulted in an average discounted lifetime cost of $1.4 million. Public revenues paid for roughly 7% of all motor vehicle crash costs, costing tax payers $18 billion in 2010, the equivalent of over $156 in added taxes for every household in the United States.
Worryingly, alcohol involved crashes accounted for $52 billion or 22% of all economic costs, and 84 percent of these costs occurred in crashes where a driver or non‐occupant had a blood alcohol concentration (BAC) of .08 grammes/decilitre or greater. Alcohol was the cause of the crash in roughly 82% of these cases, causing $43 billion in costs. Crashes in which alcohol levels are BAC of .08 or higher are responsible for over 90% of the economic costs and societal harm that occurs in crashes attributable to alcohol use. Crashes in which police indicate that at least one driver was exceeding the legal speed limit or driving too fast for conditions cost $52 billion in 2010. Seat belt use prevented 12,500 fatalities, 308,000 serious injuries, and $50 billion in injury related costs in 2010, but the failure of a substantial portion of the driving population to buckle up caused 3,350 unnecessary fatalities, 54,300 serious injuries, and cost society $10 billion in easily preventable injury related costs.
Meanwhile crashes in which at least one driver was identified as being distracted cost $40 billion in 2010. The report also includes data on the costs associated with motorcycle crashes, failure to wear motorcycle helmets, pedestrian crash, cyclist crashes, and numerous different roadway designation crashes.


